- 您现在的位置:买卖IC网 > PDF目录97935 > EVB3013A W3013 Indirect Quadrature Modulator with Gain Control PDF资料下载
参数资料
| 型号: | EVB3013A |
| 英文描述: | W3013 Indirect Quadrature Modulator with Gain Control |
| 中文描述: | W3013间接正交调制器的增益控制 |
| 文件页数: | 9/12页 |
| 文件大小: | 145K |
| 代理商: | EVB3013A |
W3013 Indirect Quadrature Modulator
Preliminary Data Sheet
with Gain Control
November 1998
6
Lucent Technologies Inc.
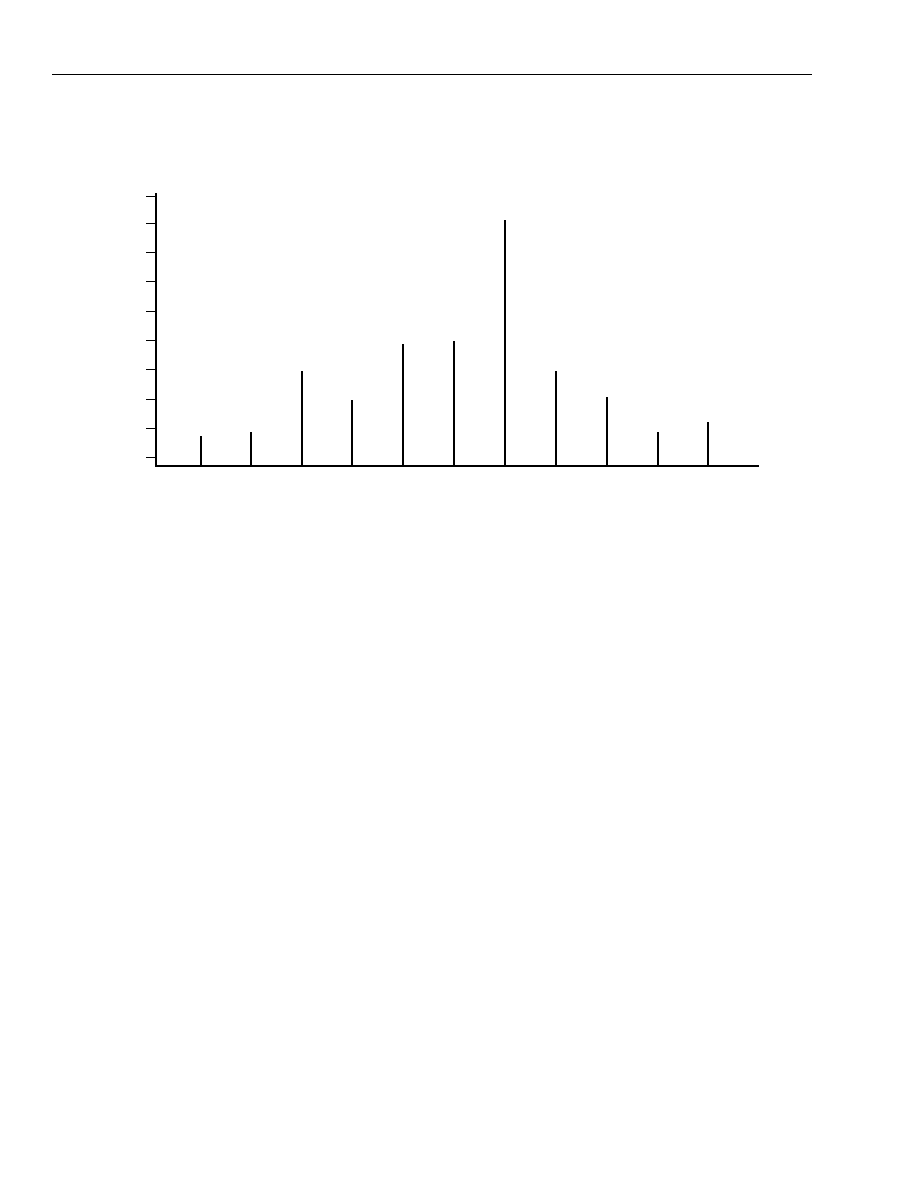
Error Vector Magnitude (EVM) Testing
Error vector magnitude (EVM) is estimated by feeding signals to the W3013 as described at the top of the
Electrical Characteristics table. A narrowband, sine-wave modulation output spectrum is shown in Figure 3.
U5
–77 dBm
U4
–84 dBm
U3
–71 dBm
U2
–63 dBm
USB
–10 dBm
CARRIER
–50 dBm
LSB
–53 dBm
L2
–72 dBm
L3
–61 dBm
L4
–81 dBm
L5
–82 dBm
–20
–30
–40
–50
–60
–70
–80
fBB = 80 kHz
fLO1= 178 MHz
fLO2 = 1620 MHz
RFOUT= 1442.08 MHz
RELATIVE
MAGNITUDE
(dBm)
1441.60 1441.68 1441.76 1441.84 1441.92
1442.08 1442.16 1442.24 1442.32
1442.40
1442
–10
–90
0
FREQUENCY (MHz)
Figure 3. W3013 Sine-Wave Modulation Output Spectrum
Data from this spectrum are used to estimate EVM by the formula:
EVM (%) =
100
[10
P(L5)/20
+ 10
P(L4)/20
+ 10
P(L3)/20
+ 10
P(L2)/20
+
10
P(LSB)/20
+ 10
P(U2)/20
+ 10
P(U3)/20
+ 10
P(U4)/20
+ 10
P(U5)/20
]/10
P(USB)/20
The data presented in the spectrum above would yield:
EVM (%) = 100
[79e–6 + 89e–6 + 891e–6 + 251e–6 + 2239e–6 + 708e–6 + 282e–6 + 63e–6 +
141e–6]/0.316e
= 1.5%
This approximates worst-case digital modulation results because the sine-wave modulation estimate assumes all
spurious outputs are in phase and adds their magnitudes as scalars. In addition, this estimate includes full-
amplitude measurements of spurious peaks that would appear in adjacent and alternate channels, where a
receiver would otherwise provide attenuation. The L3 third-order intermodulation peak and LSB (lower sideband)
are normally the unwanted output frequencies that dominate the EVM estimate.
相关PDF资料 |
PDF描述 |
|---|---|
| EVB3020A | GSM Multiband RF Transceiver |
| EVB3020A-IFBD | GSM Multiband RF Transceiver |
| EVB3030A | W3030 3 V Dual-Mode IF Cellular Receiver |
| EVB72001 | EVB72001 EValuation board for TH72001 |
| EVB72002 | EVB72002 EValuation Board for TH72002 |
相关代理商/技术参数 |
参数描述 |
|---|---|
| EVB3020A | 制造商:AGERE 制造商全称:AGERE 功能描述:GSM Multiband RF Transceiver |
| EVB3020A-IFBD | 制造商:AGERE 制造商全称:AGERE 功能描述:GSM Multiband RF Transceiver |
| EVB3030A | 制造商:AGERE 制造商全称:AGERE 功能描述:W3030 3 V Dual-Mode IF Cellular Receiver |
| EVB-3250 | 功能描述:界面开发工具 Evaluation Board RoHS:否 制造商:Bourns 产品:Evaluation Boards 类型:RS-485 工具用于评估:ADM3485E 接口类型:RS-485 工作电源电压:3.3 V |
| EVB32-M8L | 制造商:Leviton Manufacturing Co 功能描述: |
发布紧急采购,3分钟左右您将得到回复。