- 您现在的位置:买卖IC网 > PDF目录79688 > LC010F (LINEAGE POWER LLC) DC-DC REG PWR SUPPLY MODULE PDF资料下载
参数资料
| 型号: | LC010F |
| 厂商: | LINEAGE POWER LLC |
| 元件分类: | 电源模块 |
| 英文描述: | DC-DC REG PWR SUPPLY MODULE |
| 文件页数: | 14/24页 |
| 文件大小: | 917K |
| 代理商: | LC010F |
Lineage Power
21
Data Sheet
March 27, 2008
18 Vdc to 36 Vdc or 36 Vdc to 75 Vdc Inputs, 10 W and 15 W
LC/LW010- and LC/LW015-Series Power Modules:
Thermal Considerations (continued)
8-1380(C)
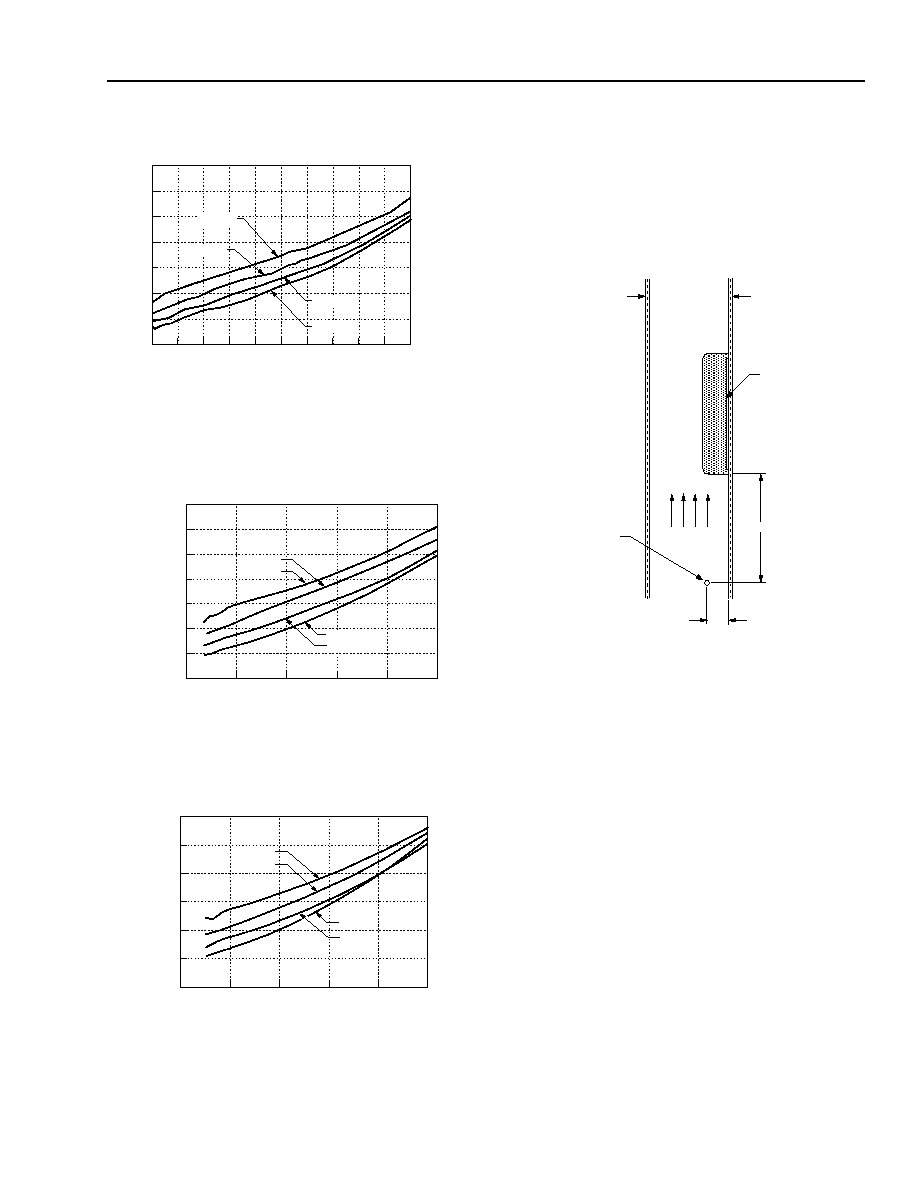
Figure 58. LW010A, B, C Typical Power Dissipation
vs. Normalized Output Current at
TC = 25 °C
8-1816(C)
Figure 59. LW010F Typical Power Dissipation vs.
Output Current at TC = 25 °C
8-1817(C)
Figure 60. LW010AJ, BK, CL Typical Power
Dissipation vs. Normalized Output
Current at TC = 25 °C
Module Derating
determined by measurements obtained in an experi-
mental apparatus shown in Figure 61. Note that the
module and the printed-wiring board (PWB) that it is
mounted on are both vertically oriented. The passage
has a rectangular cross section.
8-1126(C).d
Note: Dimensions are in millimeters and (inches).
Figure 61. Experimental Test Setup
Layout Considerations
Copper paths must not be routed beneath the power
module standoffs.
0.1
0.2
0.3
0.4
0.5
0.6
0.0
2.5
NORMALIZED OUTPUT CURRENT (IO/IO, max)
1.5
1.0
0.5
2.0
PO
WER
DISSIP
A
TION,
P
D
(W)
VI = 75 V
3.5
0.7
0.8
0.9
1.0
0.0
VI = 48 V
VI = 36 V
3.0
VI = 60 V
1.0
0.0
2.0
3.0
3.5
0.5
1.5
2.5
0.5
1.0
1.5
2.0
2.5
0.0
OUTPUT CURRENT, IO (A)
VI = 36 V
VI = 48 V
PO
WER
DISSIP
A
TION,
P
D
(W)
VI = 60 V
VI = 75 V
0.2
0.4
0.6
0.8
1.0
0.0
2.5
1.5
1.0
2.0
0.0
3.0
0.5
NORMALIZED OUTPUT CURRENT,
IO1 = IO2 [(IO1 + IO2)/(IO1, max + IO2, max)]
VI = 36 V
VI = 48 V
VI = 60 V
PO
WER
DISSIP
A
TION,
P
D(W)
VI = 75 V
AIR VELOCITY
AND AMBIENT
TEMPERATURE
MEASURED
BELOW THE
MODULE
AIRFLOW
13 (0.5)
FACING PWB
MODULE
76 (3.0)
PWB
相关PDF资料 |
PDF描述 |
|---|---|
| LM2574HV-5.0BWM | SWITCHING REGULATOR, 52 kHz SWITCHING FREQ-MAX, PDSO14 |
| LW005B | 1-OUTPUT 5 W DC-DC REG PWR SUPPLY MODULE |
| LTC6992CDCB6-2#PBF | SWITCHING CONTROLLER, PDSO6 |
| LM2675-3.3MWC | 2.2 A SWITCHING REGULATOR, 275 kHz SWITCHING FREQ-MAX, UUC |
| LM4051BIX3-1.2+T | 1-OUTPUT TWO TERM VOLTAGE REFERENCE, 1.225 V, PDSO3 |
相关代理商/技术参数 |
参数描述 |
|---|---|
| LC01-1001G | 制造商:SEI Stackpole Electronics Inc 功能描述: |
| LC01-1004G | 制造商:SEI Stackpole Electronics Inc 功能描述: |
| LC01-2702G | 制造商:SEI Stackpole Electronics Inc 功能描述: |
发布紧急采购,3分钟左右您将得到回复。