- 您现在的位置:买卖IC网 > PDF目录98030 > MPS6560RL1 (ON SEMICONDUCTOR) 500 mA, 25 V, NPN, Si, SMALL SIGNAL TRANSISTOR, TO-92 PDF资料下载
参数资料
| 型号: | MPS6560RL1 |
| 厂商: | ON SEMICONDUCTOR |
| 元件分类: | 小信号晶体管 |
| 英文描述: | 500 mA, 25 V, NPN, Si, SMALL SIGNAL TRANSISTOR, TO-92 |
| 封装: | PLASTIC, TO-226AA, 3 PIN |
| 文件页数: | 24/33页 |
| 文件大小: | 294K |
| 代理商: | MPS6560RL1 |
第1页第2页第3页第4页第5页第6页第7页第8页第9页第10页第11页第12页第13页第14页第15页第16页第17页第18页第19页第20页第21页第22页第23页当前第24页第25页第26页第27页第28页第29页第30页第31页第32页第33页
9–19
Reliability and Quality Assurance
Motorola Small–Signal Transistors, FETs and Diodes Device Data
147
148
149
150
151
152
153
154
1
2
3
4
5
6
7
8
9
10
11
12
13
14
15
16
18
19
20
21
22
23
24
25
26
27
28
29
30
31
32
33
34
35
36
37
38
39 40
41
42
43
44
45
46
47
48
49
50
51
52
53
54
55
56
57
58
59
60
61
62
63
64
65
66
67
68
69
70
71
72
73
74
75
0
1
2
3
4
5
6
7
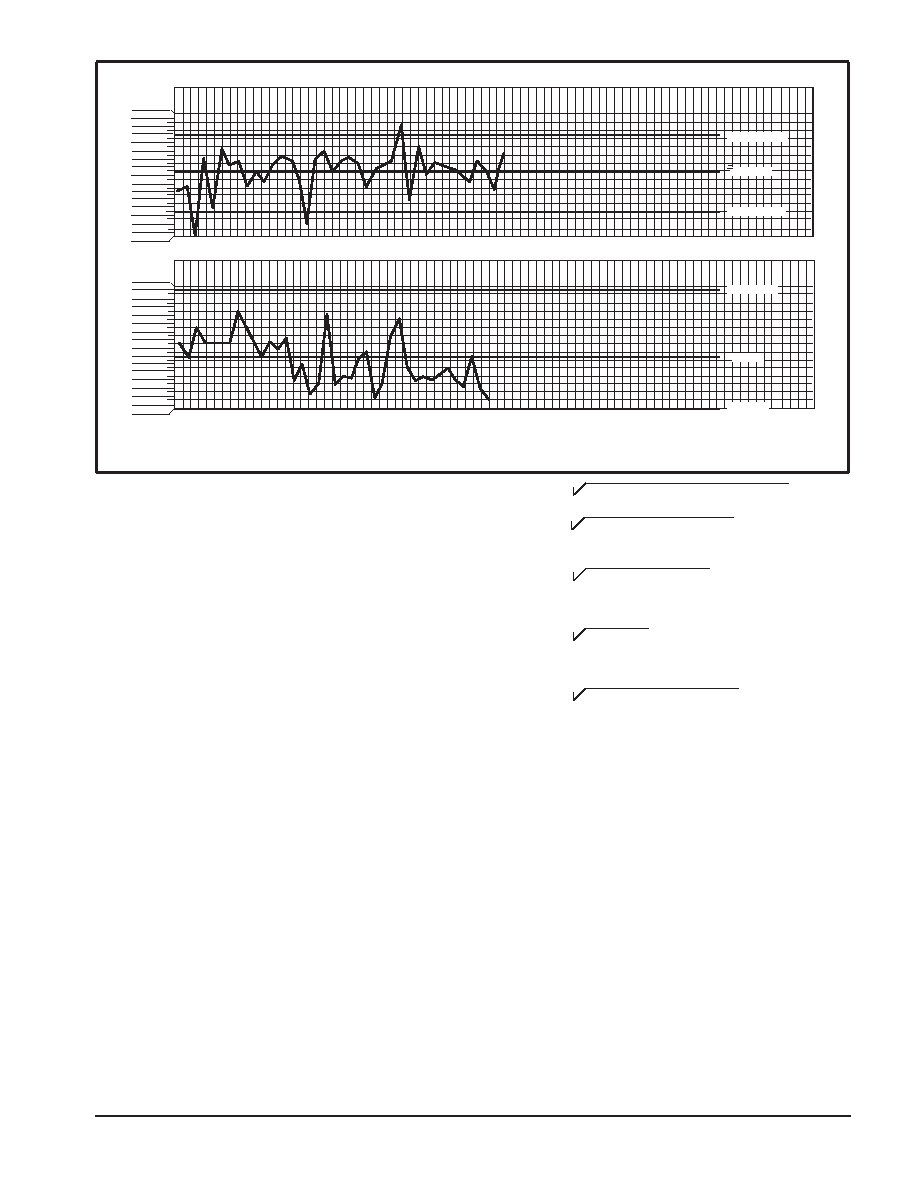
UCL = 152.8
= 150.4
LCL = 148.0
UCL = 7.3
= 3.2
LCL = 0
X
R
Figure 4. Example of Process Control Chart Showing Oven Temperature Data
Where D4, D3, and A2 are constants varying by sample size,
with values for sample sizes from 2 to 10 shown in the
following partial table:
n234
56789
10
D4
3.27
2.57
2.28
2.11
2.00
1.92
1.86
1.82
1.78
D3
*
0.08
0.14
0.18
0.22
A2
1.88
1.02
0.73
0.58
0.48
0.42
0.37
0.34
0.31
*For sample sizes below 7, the LCLR would technically be a negative number;
in those cases there is no lower control limit; this means that for a subgroup size
6, six ‘‘identical’’ measurements would not be unreasonable.
Control charts are used to monitor the variability of critical
process parameters. The R chart shows basic problems with
piece to piece variability related to the process. The X chart can
often identify changes in people, machines, methods, etc. The
source of the variability can be difficult to find and may require
experimental design techniques to identify assignable causes.
Some general rules have been established to help determine
when a process is OUT–OF–CONTROL. Figure 5 shows a
control chart subdivided into zones A, B, and C corresponding
to 3 sigma, 2 sigma, and 1 sigma limits respectively. In Figures
6 through 9 four of the tests that can be used to identify
excessive variability and the presence of assignable causes
are shown. As familiarity with a given process increases, more
subtle tests may be employed successfully.
Once the variability is identified, the cause of the variability
must be determined. Normally, only a few factors have a
significant impact on the total variability of the process. The
importance of correctly identifying these factors is stressed in
the following example. Suppose a process variability depends
on the variance of five factors A, B, C, D, and E. Each has a
variance of 5, 3, 2, 1, and 0.4, respectively.
Since:
σ tot =
σ A2 + σ B2 + σ C2 + σ D2 + σ E2
σ tot =
52 + 32 + 22 + 12 +(0.4)2 = 6.3
If only D is identified and eliminated, then:
σ tot =
52 + 32 + 22 + (0.4)2 = 6.2
This results in less than 2% total variability improvement. If
B, C, and D were eliminated, then:
σ tot =
52 + (0.4)2 = 5.02
This gives a considerably better improvement of 23%. If
only A is identified and reduced from 5 to 2, then:
σ tot =
22 + 32 + 22 + 12 + (0.4)2 = 4.3
Identifying and improving the variability from 5 to 2 yields a
total variability improvement of nearly 40%.
Most techniques may be employed to identify the primary
assignable cause(s). Out–of–control conditions may be
correlated to documented process changes. The product may
be analyzed in detail using best versus worst part comparisons
or Product Analysis Lab equipment. Multi–variance analysis
can be used to determine the family of variation (positional,
critical, or temporal). Lastly, experiments may be run to test
theoretical or factorial analysis. Whatever method is used,
assignable causes must be identified and eliminated in the
most expeditious manner possible.
After assignable causes have been eliminated, new control
limits are calculated to provide a more challenging variablility
criteria for the process. As yields and variability improve, it may
become more difficult to detect improvements because they
become much smaller. When all assignable causes have been
eliminated and the points remain within control limits for 25
groups, the process is said to in a state of control.
相关PDF资料 |
PDF描述 |
|---|---|
| MPS6560RLRE | 500 mA, 25 V, NPN, Si, SMALL SIGNAL TRANSISTOR, TO-92 |
| MPS6560ZL1 | 500 mA, 25 V, NPN, Si, SMALL SIGNAL TRANSISTOR, TO-92 |
| MPS6560RLRM | 500 mA, 25 V, NPN, Si, SMALL SIGNAL TRANSISTOR, TO-92 |
| MPS6714RLRE | 1000 mA, 30 V, NPN, Si, SMALL SIGNAL TRANSISTOR, TO-92 |
| MPS6714RLRA | 1000 mA, 30 V, NPN, Si, SMALL SIGNAL TRANSISTOR, TO-92 |
相关代理商/技术参数 |
参数描述 |
|---|---|
| MPS6561 | 功能描述:两极晶体管 - BJT NPN Med Pwr RoHS:否 制造商:STMicroelectronics 配置: 晶体管极性:PNP 集电极—基极电压 VCBO: 集电极—发射极最大电压 VCEO:- 40 V 发射极 - 基极电压 VEBO:- 6 V 集电极—射极饱和电压: 最大直流电集电极电流: 增益带宽产品fT: 直流集电极/Base Gain hfe Min:100 A 最大工作温度: 安装风格:SMD/SMT 封装 / 箱体:PowerFLAT 2 x 2 |
| MPS6562 | 功能描述:两极晶体管 - BJT PNP Med Power RoHS:否 制造商:STMicroelectronics 配置: 晶体管极性:PNP 集电极—基极电压 VCBO: 集电极—发射极最大电压 VCEO:- 40 V 发射极 - 基极电压 VEBO:- 6 V 集电极—射极饱和电压: 最大直流电集电极电流: 增益带宽产品fT: 直流集电极/Base Gain hfe Min:100 A 最大工作温度: 安装风格:SMD/SMT 封装 / 箱体:PowerFLAT 2 x 2 |
| MPS6562 D75Z | 制造商:Fairchild Semiconductor Corporation 功能描述:Trans GP BJT PNP 25V 1A 3-Pin TO-92 Ammo |
| MPS6562_07 | 制造商:FAIRCHILD 制造商全称:Fairchild Semiconductor 功能描述:PNP General Purpose Amplifier |
| MPS6562_D26Z | 功能描述:两极晶体管 - BJT PNP General Purpose Transistor RoHS:否 制造商:STMicroelectronics 配置: 晶体管极性:PNP 集电极—基极电压 VCBO: 集电极—发射极最大电压 VCEO:- 40 V 发射极 - 基极电压 VEBO:- 6 V 集电极—射极饱和电压: 最大直流电集电极电流: 增益带宽产品fT: 直流集电极/Base Gain hfe Min:100 A 最大工作温度: 安装风格:SMD/SMT 封装 / 箱体:PowerFLAT 2 x 2 |
发布紧急采购,3分钟左右您将得到回复。