- 您现在的位置:买卖IC网 > PDF目录66050 > PT6523G SWITCHING REGULATOR, SIP14 PDF资料下载
参数资料
| 型号: | PT6523G |
| 元件分类: | 稳压器 |
| 英文描述: | SWITCHING REGULATOR, SIP14 |
| 封装: | SIP-14 |
| 文件页数: | 2/5页 |
| 文件大小: | 500K |
| 代理商: | PT6523G |
Power Trends, Inc. 27715 Diehl Road, Warrenville, IL 60555 (800) 531-5782 Fax: (630) 393-6902 http://www.powertrends.com
For assistance or to order, call (800) 531-5782
3
0
1
2
3
4
5
0
123
456
78
Output Current (A)
PDiss
(Watts)
1.8V
2.5V
3.3V
VOUT
Power Trends, Inc. 27715 Diehl Road, Warrenville, IL 60555 (800) 531-5782 Fax: (630) 393-6902 http://www.powertrends.com
PT6520
Series
Specifications
(From previous page)
Characteristics
PT6520 SERIES
(T
a = 25
°C unless noted)
Symbols
Conditions
Min
Typ
Max
Units
Mechanical Shock
Per Mil-STD-883D, Method 2002.3,
—
500
—
G’s
1msec, half sine, fixture mounted
Mechanical Vibration
—
7.5
—
G’s
Weight
—
14
—
grams
Notes: (1) The ISR will operate down to no load with reduced specifications.
(2) Vinmin =3.1V, or Vo +0.5V, whichever is less. (See related application notes on adjusting the output voltage).
(3) For operation below 0°C, Cin and Cout must have stable characteristics. Use either low ESR tantalum or Oscon capacitors
(4) See Safe Operating Area curves for appropriate derating.
Input/Output Capacitors : The PT6520 Series requires a 330F electrolytic or tantalum input and output capacitor for proper operation in all applications. In addition the input
capacitance, C1, must be rated for a minimum of 1.2Arms ripple current. For transient or dynamic load applications, additional capacitance may be required.
CHARACTERISTIC
DATA
40
50
60
70
80
90
100
0
1
2
3
456
78
Output Current (A)
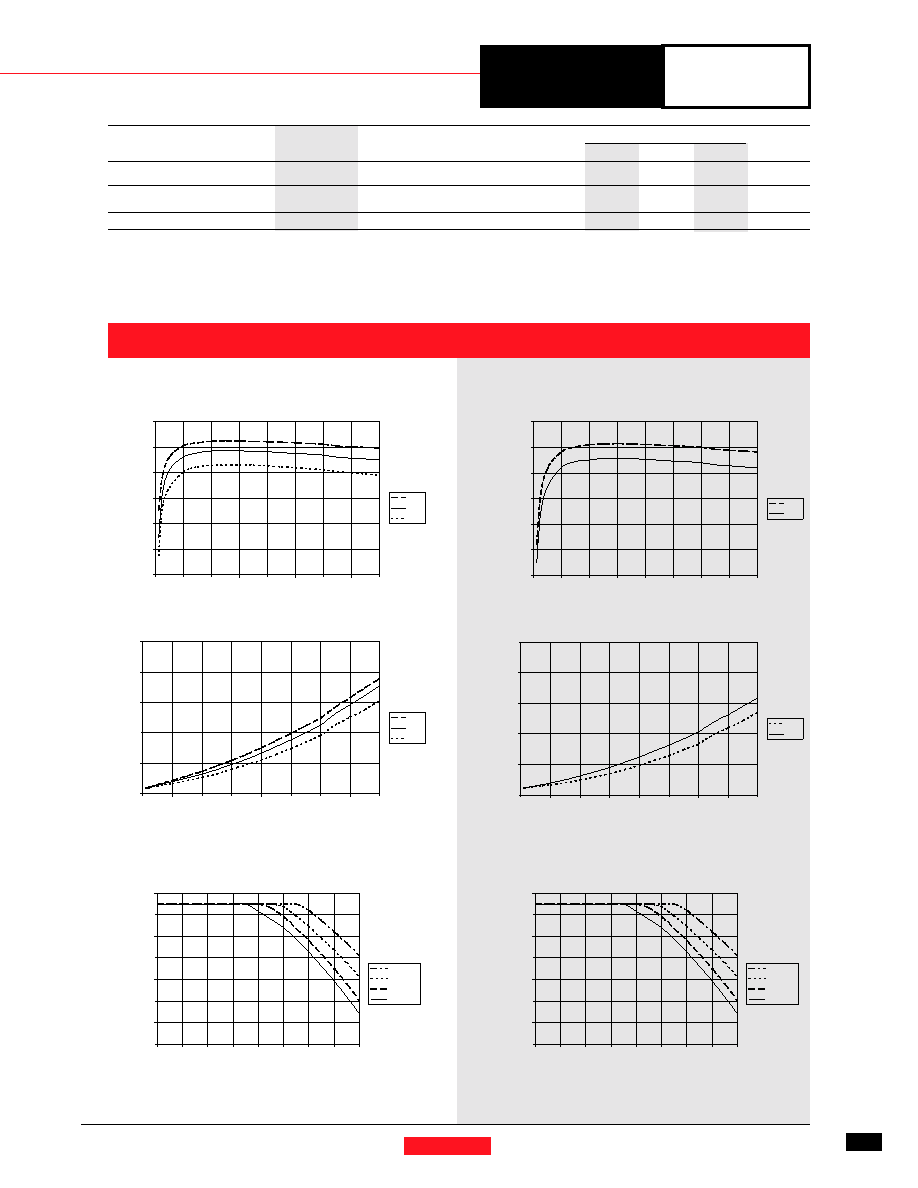
Efficiency
(%)
3.3V
2.5V
1.8V
VOUT
20
30
40
50
60
70
80
90
01
23
45
67
8
Output Current (A)
Ambient
Temperature
(
C
)
200LFM
120LFM
60LFM
Nat conv
Airflow
40
50
60
70
80
90
100
0
1
2
3
456
78
Output Current (A)
Efficiency
(%)
2.5V
1.8V
VOUT
0
1
2
3
4
5
0
123
456
78
Output Current (A)
PDiss
(Watts)
2.5V
1.8V
VOUT
PT6521, PT6523, PT6526; VIN =5.0V (See Note A)
PT6523, PT6526; VIN =3.3V (See Note A)
Efficiency vs Output Current
Power Dissipation vs Output Current
Power Dissipation Output Current
Note A: The data in the above graphs has been developed from actual products tested at 25 °C. The data is considered typical for the ISR.
Note B: The SOA curves represent conditions at which internal components are at or below the manufacturer’s maximum rated operating temperatures.
20
30
40
50
60
70
80
90
01
23
45
67
8
Output Current (A)
Ambient
Temperature
(
C
)
200LFM
120LFM
60LFM
Nat conv
Airflow
PT6526, VIN =3.3V
Safe Operating Area Curves (See Note B)
PT6521, VIN =5.0V
相关PDF资料 |
PDF描述 |
|---|---|
| PT6526E | SWITCHING REGULATOR, SIP14 |
| PT6521B | SWITCHING REGULATOR, SIP14 |
| PT6521R | SWITCHING REGULATOR, SIP14 |
| PT6521P | SWITCHING REGULATOR, SIP14 |
| PT6523D | SWITCHING REGULATOR, SIP14 |
相关代理商/技术参数 |
参数描述 |
|---|---|
| PT6523-HQ | 制造商:PTC 制造商全称:Princeton Technology Corp 功能描述:1/3 Duty General Purpose LCD Driver IC |
| PT6523L | 制造商:TI 制造商全称:Texas Instruments 功能描述:8-A 5-V/3.3-V Input Adjustable ISR with Short-Circuit protection |
| PT6523-LQ | 制造商:PTC 制造商全称:Princeton Technology Corp 功能描述:1/3 Duty General Purpose LCD Driver IC |
| PT6523LT | 功能描述:DC/DC转换器 2.5Vout 8A 5V/3.3V Inp Adj ISR RoHS:否 制造商:Murata 产品: 输出功率: 输入电压范围:3.6 V to 5.5 V 输入电压(标称): 输出端数量:1 输出电压(通道 1):3.3 V 输出电流(通道 1):600 mA 输出电压(通道 2): 输出电流(通道 2): 安装风格:SMD/SMT 封装 / 箱体尺寸: |
| PT6523M | 制造商:TI 制造商全称:Texas Instruments 功能描述:8-A 5-V/3.3-V Input Adjustable ISR with Short-Circuit protection |
发布紧急采购,3分钟左右您将得到回复。