参数资料
| 型号: | AD1380KD |
| 厂商: | Analog Devices Inc |
| 文件页数: | 3/12页 |
| 文件大小: | 0K |
| 描述: | IC ADC SNGL 16BIT 32-CDIP |
| 标准包装: | 1 |
| 位数: | 16 |
| 采样率(每秒): | 50k |
| 数据接口: | 并联 |
| 转换器数目: | 1 |
| 功率耗散(最大): | 900mW |
| 电压电源: | 双 ± |
| 工作温度: | 0°C ~ 70°C |
| 安装类型: | 通孔 |
| 封装/外壳: | 32-DIP(0.900",22.86mm) |
| 供应商设备封装: | 32-BBDIP-H |
| 包装: | 管件 |
| 输入数目和类型: | 16 个单端,双极;16 个单端,单极 |
AD1380
Rev. D | Page 11 of 12
APPLICATIONS
High performance sampling analog-to-digital converters like
the AD1380 require dynamic characterization to ensure that
they meet or exceed their desired performance parameters for
signal processing applications. Key dynamic parameters include
signal-to-noise ratio (SNR) and total harmonic distortion
(THD), which are characterized using Fast Fourier Transform
(FFT) analysis techniques.
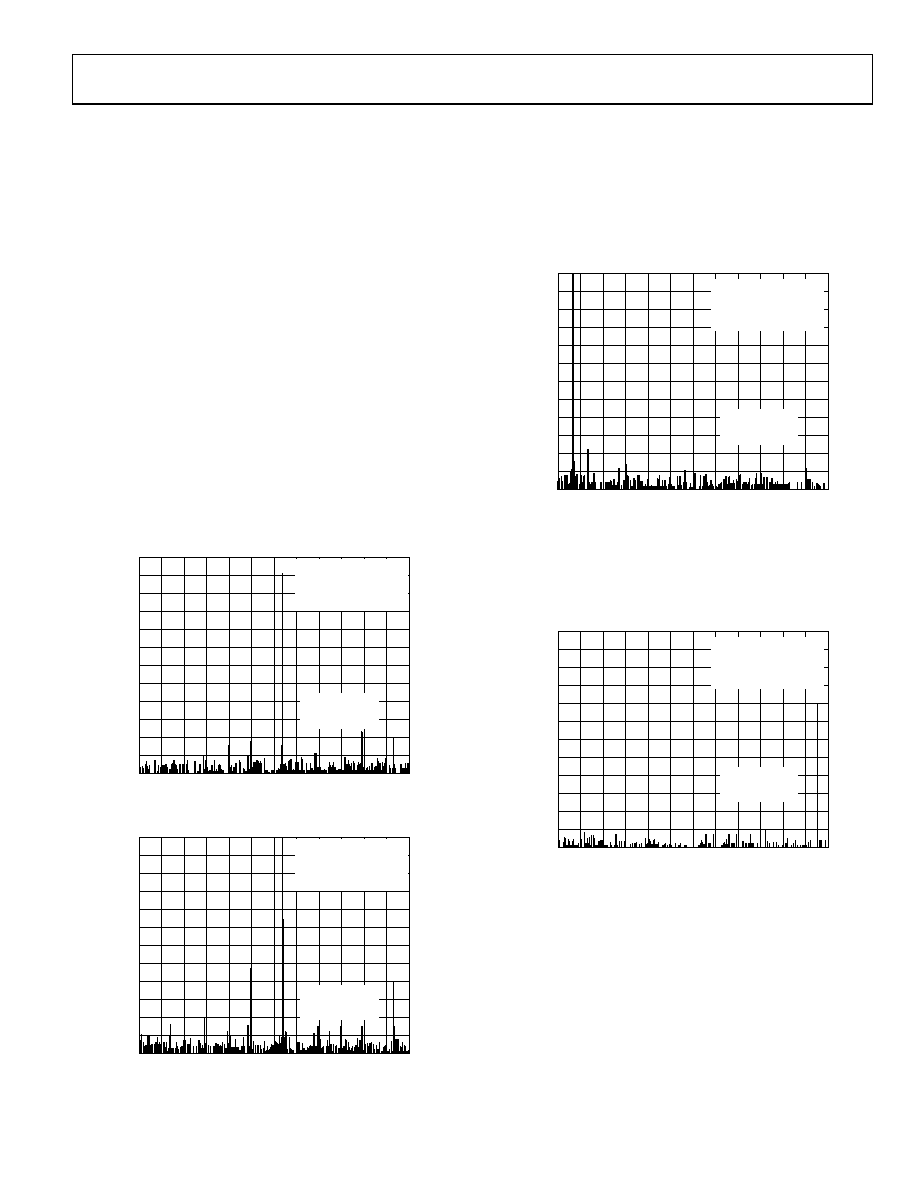
Increasing the input signal amplitude to –0.4 dB of full scale
causes THD to increase to –80.6 dB as shown in Figure 12.
At lower input frequencies, however, THD performance is
improved. Figure 13 shows a full-scale (0.3 dB) input signal at
1.41 kHz. THD is now 96.0 dB.
0
–120
–110
–100
–90
–80
–70
–60
–50
–40
–30
–20
–10
1
44
86
129 171 214 257 299 342 384 427 469 512
00764-013
FREQUENCY (
×48.8281Hz)
20V SPAN
RE
L
P
W
R
DE
NS
ITY
(dB)
2f (dB) = –97.8
3f (dB) = –102.8
4f (dB) = –106.9
FUNDAMENTAL = 1416
SAMPLE RATE = 50000
SIGNAL
(dB) = –0.3
NOISE
(dB) = –91.9
THD
(dB) = –96.0
The results of that characterization are shown in Figure 11. In
the test, a 13.2 kHz sine wave is applied as the analog input (fO)
at a level of 10 dB below full scale; the AD1380 is operated at a
word rate of 50 kHz (its maximum sampling frequency). The
results of a 1024-point FFT demonstrate the exceptional
performance of the converter, particularly in terms of low noise
and harmonic distortion.
In Figure 11, the vertical scale is based on a full-scale input
referenced as 0 dB. In this way, all (frequency) energy cells can be
calculated with respect to full-scale rms inputs. The resulting
signal-to-noise ratio is 83.2 dB, which corresponds to a noise floor
of 93.2 dB. Total harmonic distortion is calculated by adding the
rms energy of the first four harmonics and equals –97.5 dB.
Figure 13. FFT of 1.4 kHz Input Signal at 0.3 dB with a 50 kHz Sample Rate
0
–120
–110
–100
–90
–80
–70
–60
–50
–40
–30
–20
–10
1
44
86
129 171 214 257 299 342 384 427 469 512
00
76
4-
0
12
FREQUENCY (×48.8281Hz)
RE
L
P
W
R
DE
NS
IT
Y
(d
B)
2f (dB) = –100.9
3f (dB) = –101.8
4f (dB) = –111.9
FUNDAMENTAL = 13232
SAMPLE RATE = 50000
SIGNAL
(dB) = –10.0
NOISE
(dB) = –93.2
THD
(dB) = –97.5
The ultimate noise floor can be seen with low level input signals
of any frequency. In Figure 14, the noise floor is at 94 dB, as
demonstrated with an input signal of 24 kHz at 39.8 dB.
0
–120
–110
–100
–90
–80
–70
–60
–50
–40
–30
–20
–10
1
44
86
129 171 214 257 299 342 384 427 469 512
00764-014
FREQUENCY (
×48.8281Hz)
20V SPAN
RE
L
P
W
R
DE
NS
ITY
(dB)
2f (dB) = –116.0
3f (dB) = –113.6
4f (dB) = –112.4
FUNDAMENTAL = 23975
SAMPLE RATE = 50000
SIGNAL
(dB) = –39.8
NOISE
(dB) = –94.3
THD
(dB) = –107.9
Figure 11. FFT of 13.2 kHz Input Signal at 10 dB with a 50 kHz Sample Rate
0
–120
–110
–100
–90
–80
–70
–60
–50
–40
–30
–20
–10
1
44
86
129 171 214 257 299 342 384 427 469 512
00
76
4-
0
1
FREQUENCY (×48.8281Hz)
R
E
L
P
W
R
DE
NS
IT
Y
(
d
B)
2f (dB) = –80.7
3f (dB) = –99.9
4f (dB) = –102.9
FUNDAMENTAL = 13232
SAMPLE RATE = 50000
SIGNAL
(dB) = –0.4
NOISE
(dB) = –91.0
THD
(dB) = –80.6
Figure 14. FFT of 24 kHz Input Signal at 39.8 dB with a 50 kHz Sample Rate
Figure 12. FFT of 13.2 kHz Input Signal at 0.4 dB with a 50 kHz Sample Rate
相关PDF资料 |
PDF描述 |
|---|---|
| AD1555BP | IC ADC PGA 24BIT LN 28PLCC |
| AD1671KQ | IC ADC SNGL 12BIT 28-CDIP |
| AD1674BD | IC ADC 12BIT 100KSPS 28-CDIP |
| AD1871YRSZ-REEL | IC ADC STEREO 24BIT 96KHZ 28SSOP |
| AD1877JRZ-RL | IC ADC STEREO 16BIT 28-SOIC |
相关代理商/技术参数 |
参数描述 |
|---|---|
| AD-1381 | 功能描述:折皱器 CrimpTool for D-436 RoHS:否 制造商:Hirose Connector 类型: 描述/功能:Cable and Shield Crimper |
| AD-1381-CRIMP-TOOL-3-C | 制造商:RAYCHEM / TYCO ELEC 功能描述:CS1660-000 |
| AD-1381-CRIMP-TOOL-3-CVTY | 功能描述:TOOL HAND CRIMP 12-26AWG SPLICE RoHS:否 类别:工具 >> 压接器,施用器,压力机 系列:- 产品培训模块:Board-to-Wire Connectors 标准包装:1 系列:DF11 工具类型:台式压机,施用器 适用于相关产品:矩形触点,24-28 AWG 特点:- 配用:H1505TR-ND - CONN SOCKET 24-28AWG CRIMP GOLDH1504TR-ND - CONN SOCKET 24-28AWG CRIMP TIN 相关产品:AP105-DF11-2428S(64)-ND - TOOL APPLICATOR DF11 ACCESSORIESAP105-DF11-2428S(63)-ND - TOOL APPLICATOR DF11 ACCESSORIESAP105-DF11-2428S(62)-ND - TOOL APPLICATOR DF11 ACCESSORIESAP105-DF11-2428S(61)-ND - TOOL APPLICATOR DF11 ACCESSORIESCM-105 WITH TRANSFORMER-ND - TOOL AUTO CRIMPING MACHINE 其它名称:*AP105-DF11-2428SQ1139807AQ949366 |
| AD1382 | 制造商:AD 制造商全称:Analog Devices 功能描述:16-Bit 500 kHz Sampling ADC |
| AD1385 | 制造商:AD 制造商全称:Analog Devices 功能描述:16-Bit 500 kHz Wide Temperature Range Sampling ADC |
发布紧急采购,3分钟左右您将得到回复。