- 您现在的位置:买卖IC网 > PDF目录152475 > 1-100707-01 (SENSITRON SEMICONDUCTOR) DIGITAL TEMP SENSOR-SERIAL, 14BIT(s), SQUARE, SURFACE MOUNT PDF资料下载
参数资料
| 型号: | 1-100707-01 |
| 厂商: | SENSITRON SEMICONDUCTOR |
| 元件分类: | Switch/Digital Output Temperature Sensor |
| 英文描述: | DIGITAL TEMP SENSOR-SERIAL, 14BIT(s), SQUARE, SURFACE MOUNT |
| 封装: | ROHS COMPLIANT PACKAGE, 6 PIN |
| 文件页数: | 6/12页 |
| 文件大小: | 332K |
| 代理商: | 1-100707-01 |
Datasheet SHT21
www.sensirion.com
Version 1.1 – May 2010
3/12
Users Guide SHT2x
1 Extended Specification
For details on how Sensirion is specifying and testing
accuracy performance please consult Application Note
“Statement on Sensor Specification”.
1.1
Operating Range
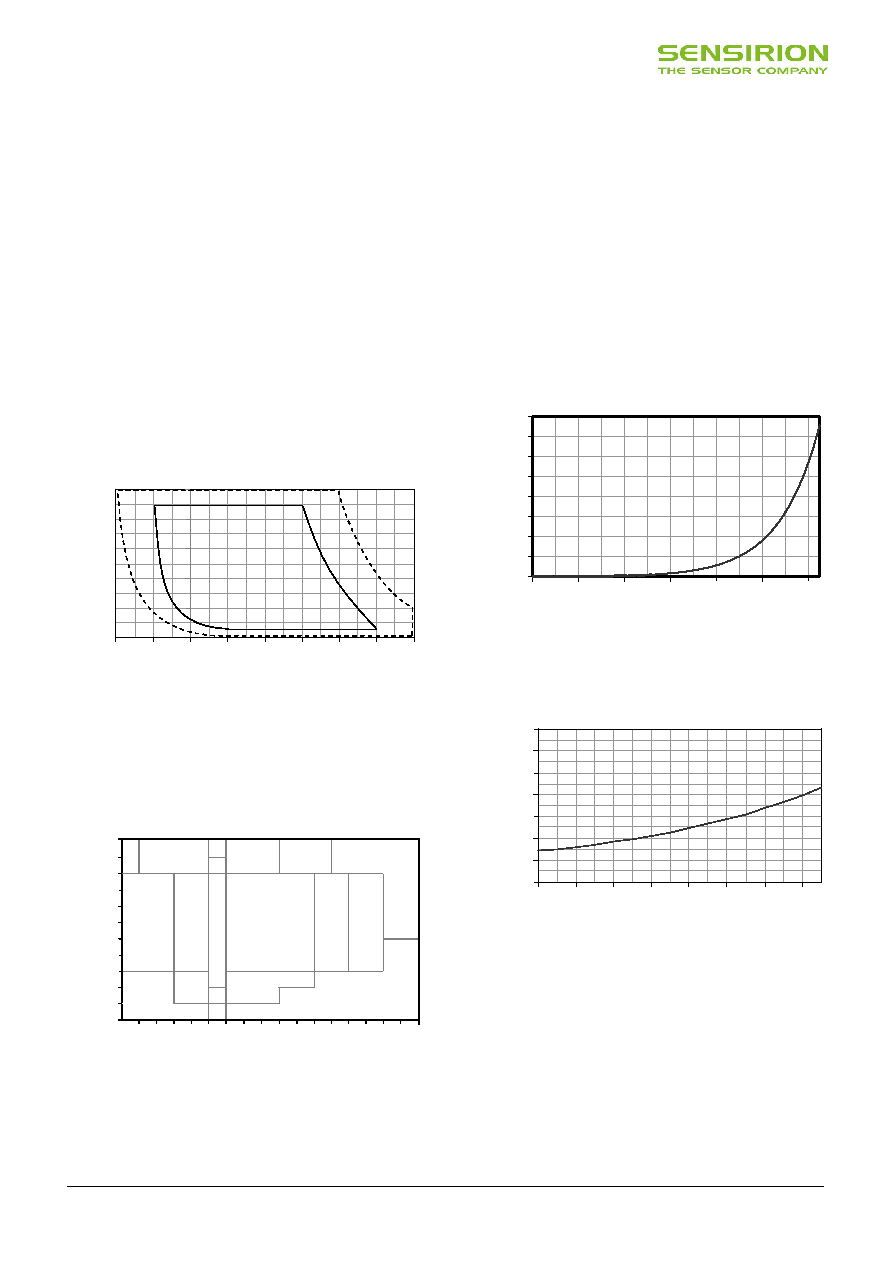
The sensor works stable within recommended Normal
Range – see Figure 4. Long term exposure to conditions
outside Normal Range, especially at humidity >80%RH,
may temporarily offset the RH signal (+3%RH after 60h).
After return into the Normal Range it will slowly return
towards calibration state by itself. See Section 2.3
“Reconditioning Procedure” for eliminating the offset.
Prolonged exposure to extreme conditions may accelerate
ageing.
Figure 4 Operating Conditions
1.2
RH accuracy at various temperatures
Maximal tolerance for RH accuracy at 25°C is defined in
Figure 2. For other temperatures maximal tolerance has
been evaluated to be within limits displayed in Figure 5.
100
±5
90
±6
±5
±4
±5
±7
±8
80
70
60
50
40
30
±4
±3
±4
±6
20
10
±6
±5
±4
±5
R
el
at
iv
e
H
u
m
idi
ty
(%
R
H
)
0
±5
±7
0 5 10 15 20 25 30 35 40 45 50 55 60 65 70 75 80
Temperature (°C)
Figure 5 Maximal tolerance of relative humidity measurements
given in %RH for temperatures 0 – 80°C.
Please note that above values are maximal tolerances (not
including hysteresis) against a high precision reference
such as a dew point mirror. Typical deviations are at
±2%RH where maximal tolerance is ±3%RH and about
half the maximal tolerance at other values.
1.3
Electrical Specification
Current consumption as given in Table 1 is dependent on
temperature and supply voltage VDD. For estimations on
energy consumption of the sensor Figures 6 and 7 may be
consulted. Please note that values given in these Figures
are of typical nature and the variance is considerable.
0
1
2
3
4
5
6
7
8
0
20
40
60
80
100
120
Temperature (°C)
S
u
p
ly
C
u
rr
en
t
ID
D
(
A
)
Figure 6 Typical dependency of supply current (sleep mode)
versus temperature at VDD = 3.0V. Please note that the
variance of these data is about ±25% of displayed value.
6
8
10
12
14
16
18
20
2.1
2.3
2.5
2.7
2.9
3.1
3.3
3.5
Supply Voltage (VDD)
S
u
p
ly
C
u
rr
e
n
t
ID
D
(n
A
)
Figure 7 Typical dependency of supply current (sleep mode)
versus supply voltage at 25°C. Please note that deviations may
be up to ±50% of displayed value. Values at 60°C scale with a
factor of about 15 (compare Table 1).
0
20
40
60
80
100
-40
-20
0
20
40
60
80
100
120
Temperature (°C)
R
e
la
ti
v
e
H
u
m
id
it
y
(%
)
Max.
Range
Normal
Range
相关PDF资料 |
PDF描述 |
|---|---|
| 1-100645-01 | DIGITAL TEMP SENSOR-SERIAL, 14BIT(s), SQUARE, SURFACE MOUNT |
| 1-102154-0 | 50 CONTACT(S), MALE, STRAIGHT TWO PART BOARD CONNECTOR, SOLDER |
| 1-102154-1 | 60 CONTACT(S), MALE, STRAIGHT TWO PART BOARD CONNECTOR, SOLDER |
| 1-102154-2 | 64 CONTACT(S), MALE, STRAIGHT TWO PART BOARD CONNECTOR, SOLDER |
| 1-102321-0 | 50 CONTACT(S), MALE, STRAIGHT TWO PART BOARD CONNECTOR, SOLDER |
相关代理商/技术参数 |
参数描述 |
|---|---|
| 11-007082-000 | 制造商:Amphenol Corporation 功能描述:11-007082-000 - Bulk |
| 11-007-172 | 功能描述:电缆组件 FLAT PIN STAKED FLEX MALE/FEMALE TIN ENDS RoHS:否 制造商:Molex 产品:Power Assemblies 类型:Cable Assembly 连接器端口 A:No Connector 连接器端口 A 管脚计数:4 连接器端口 B:No Connector 连接器端口 B 管脚计数: 型式:Male 线规 - 美国线规(AWG):20, 28 长度:0.305 m 颜色:Black, Red |
| 11-007295-000 | 制造商:Amphenol Corporation 功能描述:11-007295-000 - Bulk |
| 11-007345-000 | 制造商:Amphenol Corporation 功能描述:11-007345-000 - Bulk |
| 11-007368-000 | 制造商:Amphenol Corporation 功能描述:TOOL - Bulk |
发布紧急采购,3分钟左右您将得到回复。