- 您现在的位置:买卖IC网 > PDF目录11767 > AD6620ASZ-REEL (Analog Devices Inc)IC DGTL RCVR DUAL 67MSPS 80-PQFP PDF资料下载
参数资料
| 型号: | AD6620ASZ-REEL |
| 厂商: | Analog Devices Inc |
| 文件页数: | 36/44页 |
| 文件大小: | 0K |
| 描述: | IC DGTL RCVR DUAL 67MSPS 80-PQFP |
| 标准包装: | 500 |
| 接口: | 并行/串行 |
| 电源电压: | 3 V ~ 3.6 V |
| 封装/外壳: | 80-BQFP |
| 供应商设备封装: | 80-PQFP(14x14) |
| 包装: | 带卷 (TR) |
| 安装类型: | 表面贴装 |
第1页第2页第3页第4页第5页第6页第7页第8页第9页第10页第11页第12页第13页第14页第15页第16页第17页第18页第19页第20页第21页第22页第23页第24页第25页第26页第27页第28页第29页第30页第31页第32页第33页第34页第35页当前第36页第37页第38页第39页第40页第41页第42页第43页第44页
AD6620
–41–
REV. A
The impulse response length of the CIC2 is given by
21
2
×
(
)
M
f
CIC
ADC
The composite impulse response length of all three stages is
NM
M
f
TAPS
CIC
ADC
××
+ ×
×
×
+
52
2
43
1
The Algorithmic Latency is
NM
M
f
TAPS
CIC
ADC
××
+ ×
×
×
+
×
52
2
43
1
2
Fixed Latency is the delay due to each register between the input
and the output of the AD6620. The latency is the count of each
register multiplied by the period of the clock that drives it. The
fixed latency of the AD6620 can be approximated by the follow-
ing expression:
10
7
5
25
tt
M
N
t
CLK
SAMP
CIC
RCF
TAPS
CLK
++
+
[]
[]+×
where:
tCLK
is the high speed clock to the AD6620.
tSAMP is the data rate delivered to the AD6620.
Normally tCLK and tSAMP are the same unless a clock multiplier is
used such as with the AD6600’s 2
× clock output.
Variable Latency is due to any differences between the asyn-
chronous edge of the SYNC pulses and the data rate. This
includes use of the internal synchronization options.
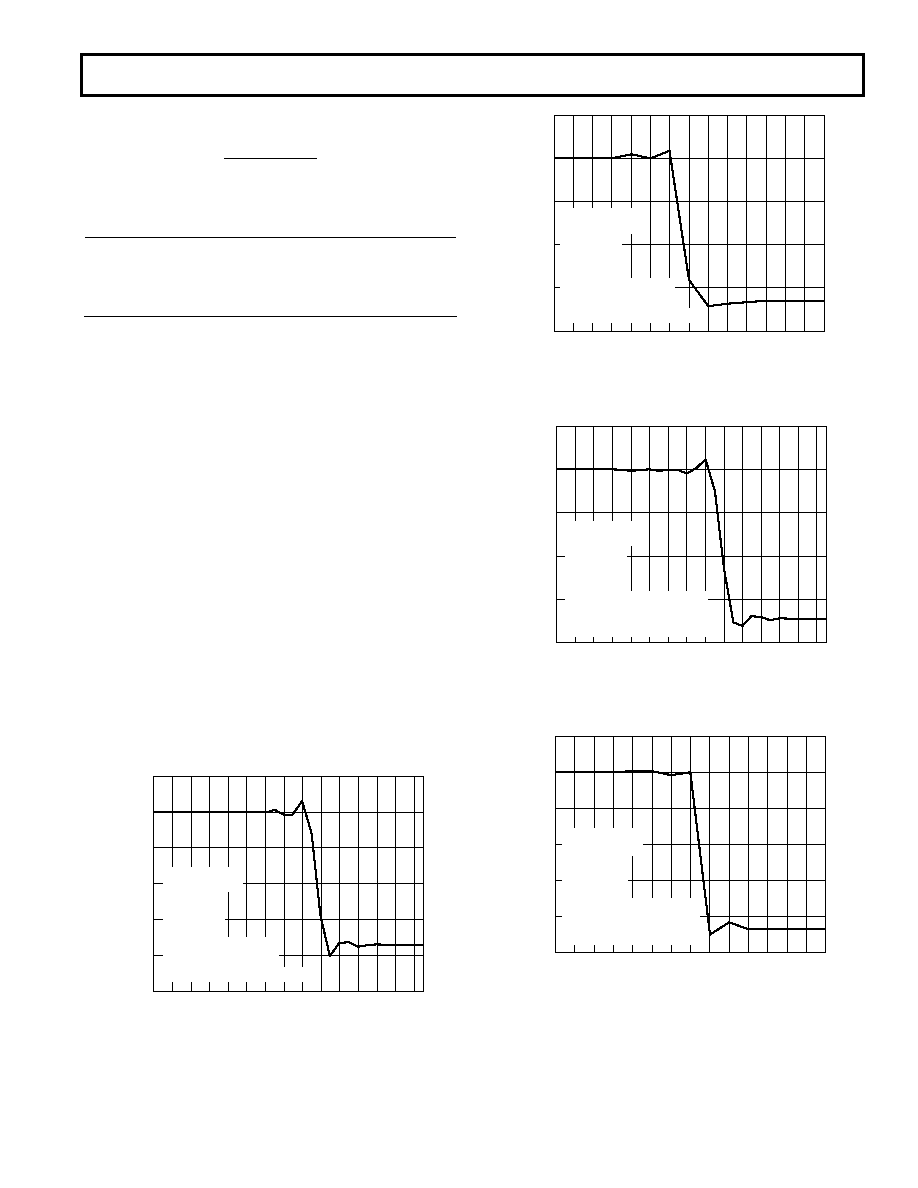
Based on the information on latency, the plots shown below
provide typical latency for a variety of different applications.
They were obtained by inserting a –FS dc step into the Input Data
Port of the AD6620. These are I channel step responses for the
input transient. The latency is defined as the output period times
number of output samples until the output reached approxi-
mately 50% of the step value.
OUTPUT SAMPLES
0.20
–0.40
–1.00
121
3
FRACTION
OF
F
S
57
9
11 13
15 17
19
0.00
–0.20
–0.60
–0.80
23
25
27 29
61.44MHz
SAMPLE RATE
MCIC2 = 16
MCIC5 = 8
MRCF = 8
NTAPS = 256
AT 19 OUTPUT SAMPLES,
THE LATENCY WOULD
BE 0.32ms
EXPECTED LATENCY = 0.303ms
Figure 52. AMPS Example
OUTPUT SAMPLES
0.20
–0.40
111
2
FRACTION
OF
F
S
34
56
7
8
9
10
0.00
–0.20
–0.60
–0.80
12
13
14
15
58.9824MHz
SAMPLE RATE
MCIC2 = 2
MCIC5 = 4
MRCF = 6
NTAPS = 48
AT 8 OUTPUT SAMPLES,
THE LATENCY WOULD
BE 6.51 s
EXPECTED LATENCY = 6.31 s
Figure 53. CDMA Example
OUTPUT SAMPLES
0.20
–0.40
121
3
FRACTION
OF
F
S
57
9
11 13
15 17
19
0.00
–0.20
–0.60
–0.80
23
25
27 29
64.512MHz
SAMPLE RATE
MCIC2 = 2
MCIC5 = 14
MRCF = 3
NTAPS = 84
AT 19 OUTPUT SAMPLES,
THE LATENCY WOULD
BE 24.7 s
EXPECTED LATENCY = 24.31 s
Figure 54. PHS Example
OUTPUT SAMPLES
0.20
–0.40
111
2
FRACTION
OF
F
S
34
56
7
8
9
10
0.00
–0.20
–0.60
–0.80
12
13
14
15
–1.00
65.0MHz
SAMPLE RATE
MCIC2 = 2
MCIC5 = 6
MRCF = 20
NTAPS = 240
AT 9 OUTPUT SAMPLES,
THE LATENCY WOULD
BE 33.23 s
EXPECTED LATENCY = 31.2 s
Figure 55. WB-GSM Example
相关PDF资料 |
PDF描述 |
|---|---|
| 6274291-2 | CONN JACK VERT PCB 75 OHM BNC |
| AD7669JNZ | IC I/O PORT 8BIT ANLG 28DIP |
| D38999/24FF11PA | CONN RCPT 11POS JAM NUT W/PINS |
| D38999/20JE26HN | CONN RCPT 26POS WALL MNT W/PINS |
| AD7569KNZ | IC I/O PORT 8BIT ANALOG 24DIP |
相关代理商/技术参数 |
参数描述 |
|---|---|
| AD6620PCB | 制造商:AD 制造商全称:Analog Devices 功能描述:65 MSPS Digital Receive Signal Processor |
| AD6620S | 制造商:AD 制造商全称:Analog Devices 功能描述:65 MSPS Digital Receive Signal Processor |
| AD6620S/PCB | 制造商:Analog Devices 功能描述:DUAL CHANNEL DECIMATING RECEIV 制造商:Analog Devices 功能描述:SGNL PROCESSOR 169CSPBGA - Bulk |
| AD6622 | 制造商:AD 制造商全称:Analog Devices 功能描述:Four-Channel, 75 MSPS Digital Transmit Signal Processor TSP |
| AD6622AS | 制造商:Analog Devices 功能描述:Transmit Signal Processor 128-Pin MQFP 制造商:Rochester Electronics LLC 功能描述:4 CHANNEL 65 MSPS DIGITAL UPCONVERTER - Bulk |
发布紧急采购,3分钟左右您将得到回复。